Single dashboard
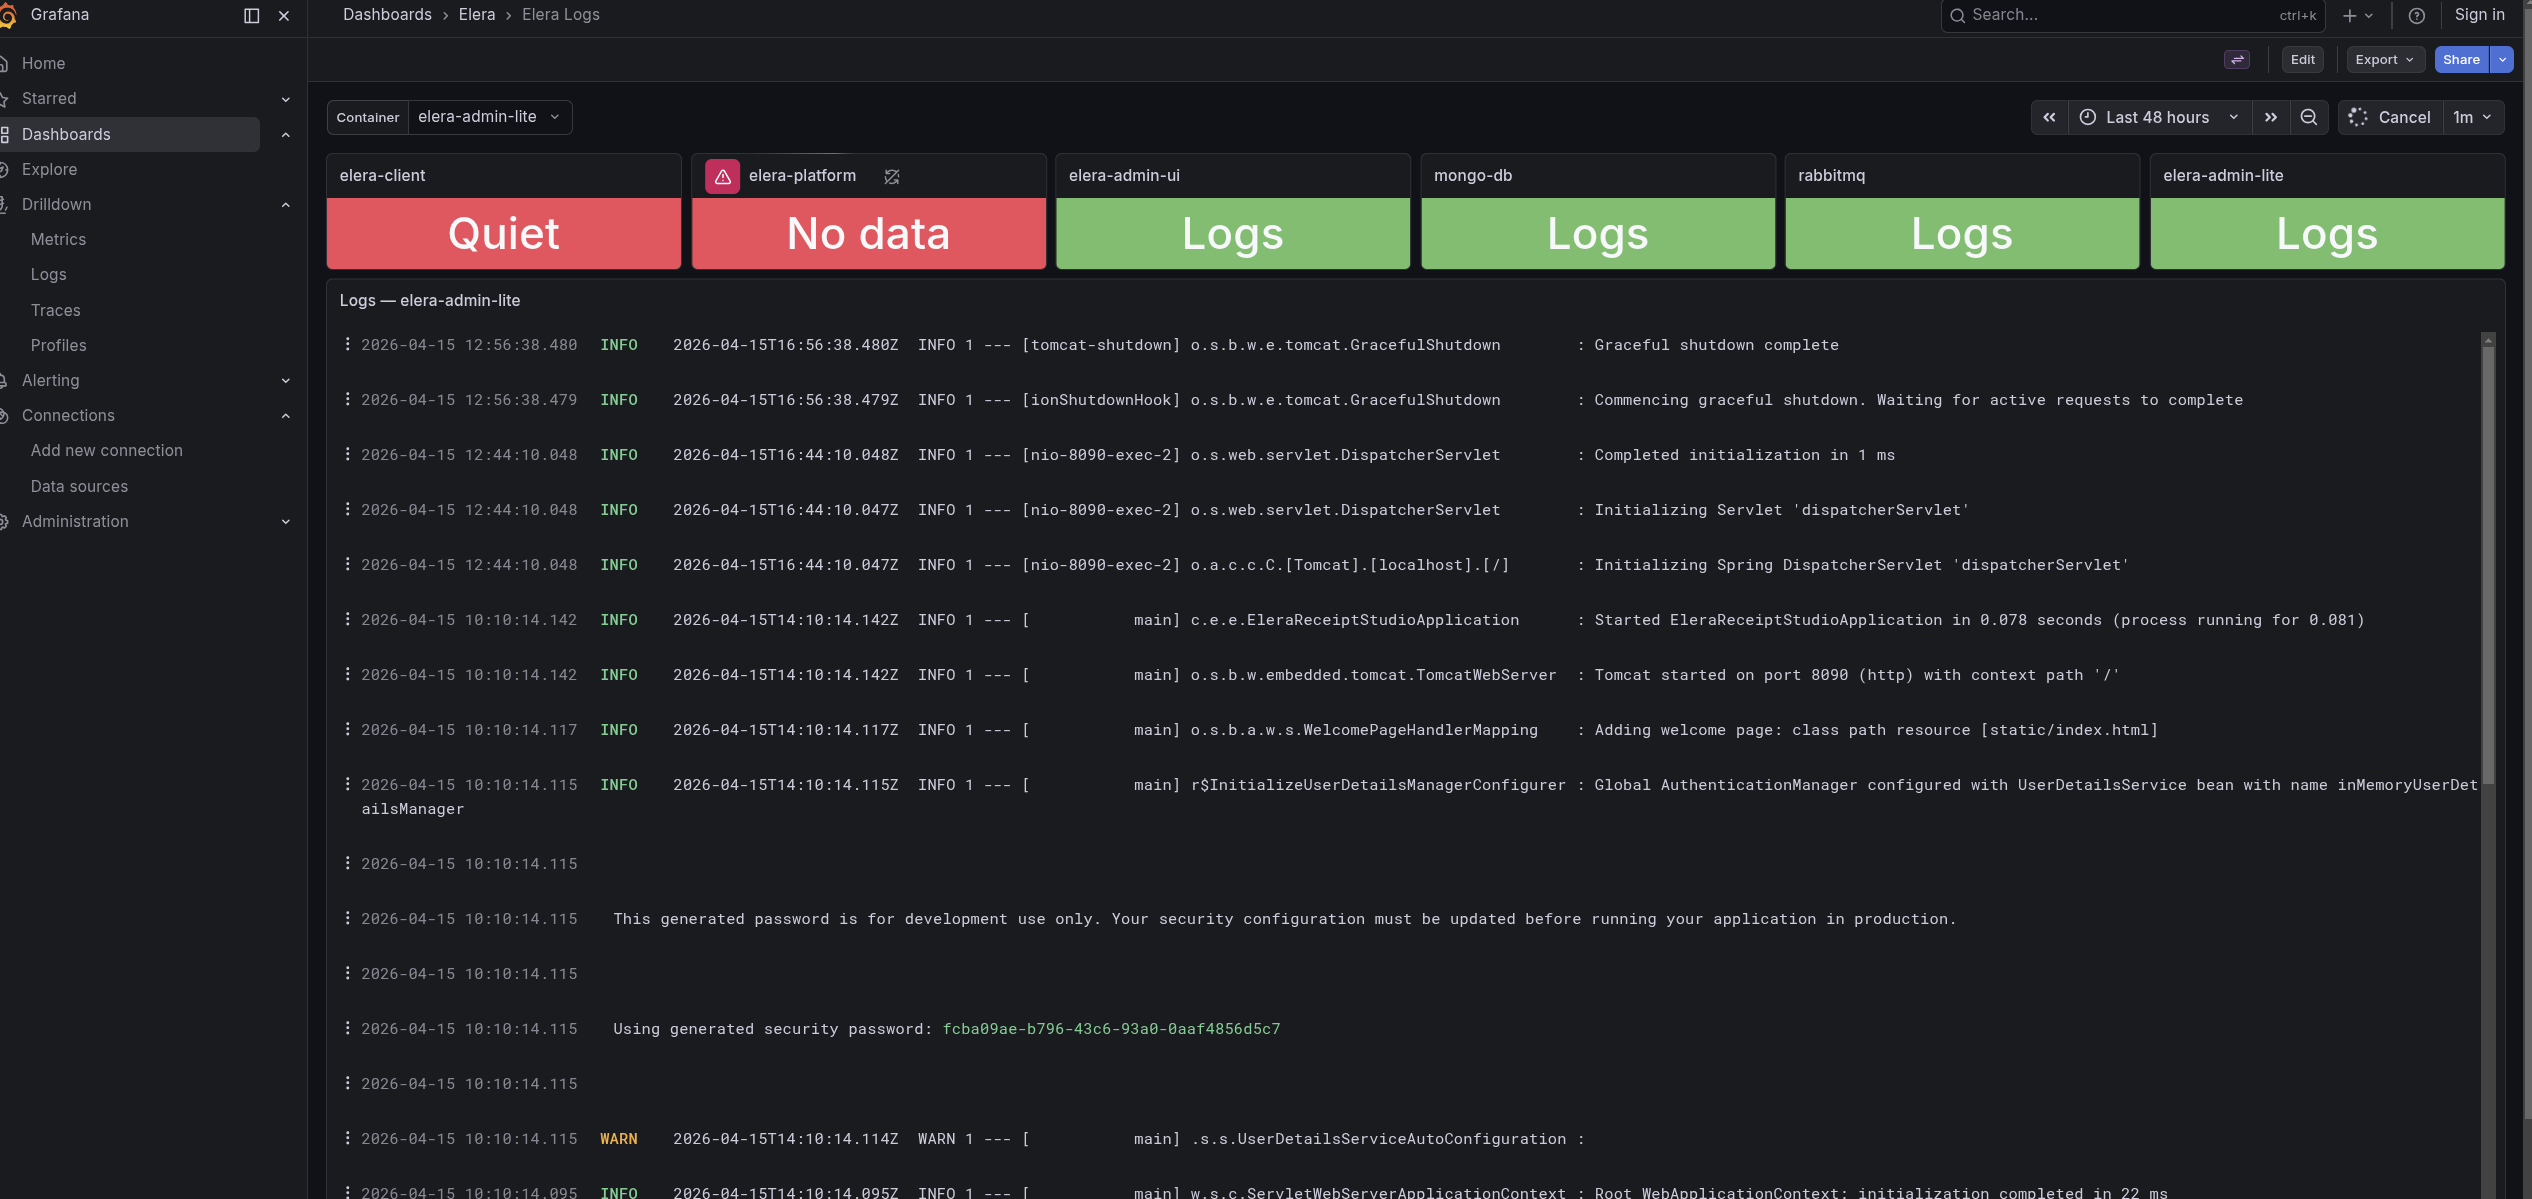
The provisioned Elera Logs dashboard centralizes log views and recent container status in Grafana.
- 1-minute default refresh
- Status cards for expected containers
- Quick drilldown into noisy services
ELERA Log Monitor
ELERA Log Monitor packages Grafana, Loki, and Promtail into a Docker Hub bundle for local ELERA environments. It gives support teams a focused dashboard for the ELERA containers they usually need to inspect first.
The bundle provisions the dashboard automatically, binds services to localhost by default, and generates machine-specific Promtail targets from the local Docker environment.
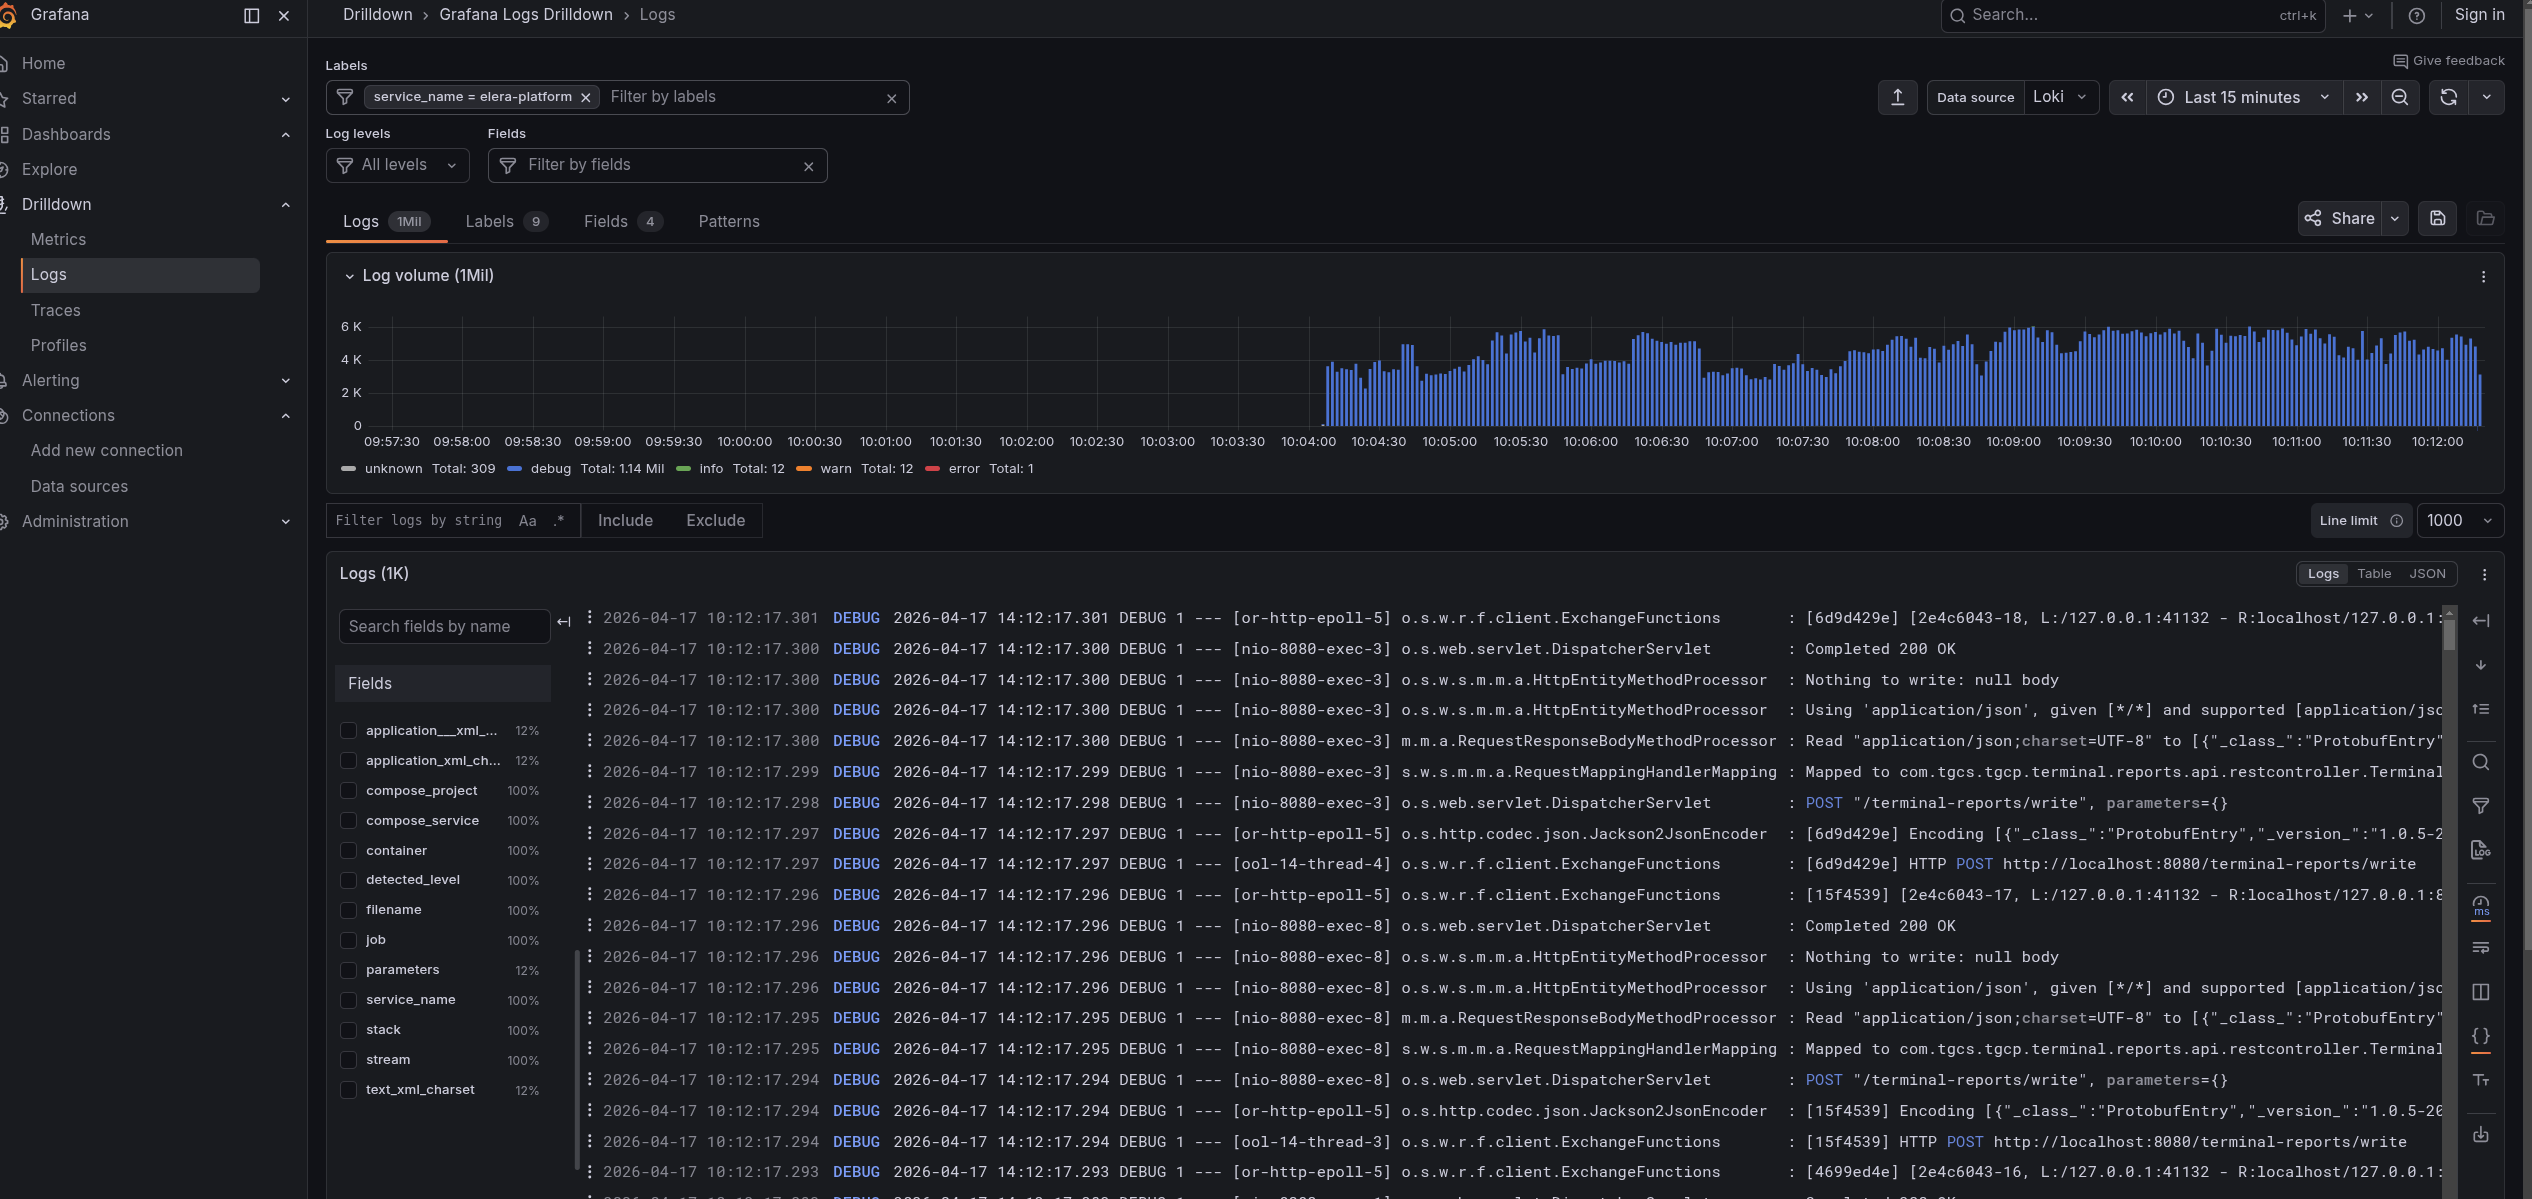
The dashboard is pre-filtered for the local ELERA services support teams usually need when troubleshooting demos, development environments, and customer support scenarios.
The provisioned Elera Logs dashboard centralizes log views and recent container status in Grafana.
Promtail reads Docker JSON logs from the Linux Docker host filesystem and sends them to Loki for fast local querying.
The public bundle image exports the compose stack locally without embedding proprietary ELERA application code.
Use the dashboard for high-level service visibility, then jump into drilldown or Explore when a specific container needs deeper review.
Pull the bundle image, export the stack, point it at your local ELERA Docker network, generate Promtail targets, and start the services.
docker pull redlistsolutions/elera-log-monitor:latest
docker run --rm -v "$PWD:/output" redlistsolutions/elera-log-monitor:latest export
cd ./elera-log-monitor
docker inspect elera-nginx --format '{{range $k, $v := .NetworkSettings.Networks}}{{$k}}{{end}}'
export ELERA_DOCKER_NETWORK=your_elera_network_name
./scripts/generate-promtail-config.sh
docker compose up -dThe monitor expects a local ELERA environment that is already running in Docker. ELERA_DOCKER_NETWORK must match the Docker network used by that ELERA stack.
The bundle is intentionally tuned for local support environments where Docker log files are available from a Linux-compatible host path.
The monitoring stack is designed for local development and support use, with the operational pieces generated on the target machine.
Grafana, Loki, and Promtail are bound to 127.0.0.1 by default to keep the stack local unless you deliberately expose it.
The repository does not store passwords, API keys, tokens, or private credentials.
Promtail paths and position files are generated locally because Docker container IDs and log paths are machine-specific.
Use the Docker Hub bundle to stand up a focused local log monitor, or talk with REDList about broader ELERA support workflows.